Data sources for FAO worldmaps of Koeppen climatologies and climatic net primary production
Jürgen Grieser, René Gommes, Stephen Cofield and
Michele Bernardi
The Agromet Group, SDRN
FAO of the UN, Viale delle Terme di Caracalla,
00100 Rome, Italy
Contact: Agromet@fao.org or juergen.grieser@rms.com
August 2006
The Koeppen climatologies and
the climatic net primary
production maps of FAO are based on different periods and precipitation
datasets. Here we provide the datasets in different formats. Furthermore some
derived information like temperature of the coldest and warmest months,
Martonnes aridity index and Gorczynskis continentality index are provided.
The original data are brought to a common grid based on USGS gtopo30
and provided as tables in csv format (.5° resolution). For the users
convenience the derived data are also provided as georeferenced data in IDA/Windisp
format (5’ resolution, resampled).
The table provides the links to the datasets used to derive the Koeppen
climatologies and npp maps. Each of the files consists of 13 columns. The first
column contains the gridpoint number, the remaining 12 columns contain the mean
annual cycle of the variable at that grid point. In the case of temperature, it
is the mean monthly temperature in °C or the standard deviation of temperature
over the respective period. Precipitation is provided in mm per month. The meta data file consists of 4 columns with
gridpoint number, longitude (in .01°), latitude (in .01°) and land fraction (in
%).
All data are provided as comma separated value (csv) in .5°x.5°
resolution. The temporal standard deviation of the variable at the grid cell
within the period is provided too. This allows a wide range of investigations.
For example, it can be used to compare the average with the variability by
estimating the coefficient of variability (standard deviation / average) in the
case of precipitation. Furthermore it can be used to estimate uncertainty
intervals for the average of each grid cell.
|
Comma Separated Value (csv) |
||||
|
|
Full
Period 1951 –
2000 |
Norm
Period 1961 –
1990 |
Early
Period 1951 –
1975 |
Late
Period 1976 - 2000 |
|
Temperature |
Average (2Mb) |
|||
CRU Precipitation
|
||||
|
GPCC
Fulldata Precipitation |
||||
|
GPCC
VASClimO Precipitation |
||||
The
meta-data file with grid point coordinates is here.
For the annual mean temperature und the annual precipitation sum we also
provide resampled georeferenced data in 5’x5’ resolution as Windisp/IDA images.
|
Georeferenced annual Data |
||||
|
|
Full
Period 1951 –
2000 |
Norm
Period 1961 –
1990 |
Early
Period 1951 –
1975 |
Late
Period 1976 -
2000 |
|
CRU Temperature |
|
|
|
|
|
CRU
Precipitation |
|
|
|
|
|
GPCC
Fulldata Precipitation
|
|
|
|
|
|
GPCC
VASClimO Precipitation |
|
|
|
|
Download
colour tables for IDA images of temperature, precipitation, number of months with temperature exceeding
10°C, and annual temperature amplitudes here.
|
Derived Temperature products
|
||||
|
|
Full
Period 1951 –
2000 |
Norm
Period 1961 – 1990 |
Early
Period 1951 –
1975 |
Late
Period 1976 -
2000 |
|
Mean
monthly temperature of coldest month |
|
|
|
|
|
Mean
monthly temperature of warmest month |
|
|
|
|
|
Mean
annual temperature amplitude |
|
|
|
|
|
Number of
months with temperature exceeding 10°C |
|
|
|
|
|
All as
csv (700kb) |
||||
Aridity and Continentality
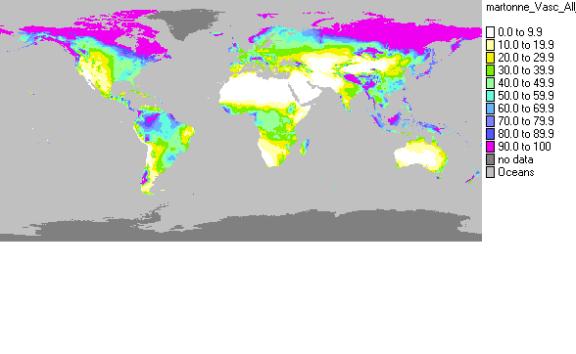
From the variety of existing indices to quantify aridity and
continentality we only provide the aridity index of De Martonne (1926) and the
continentality index of Gorczynski (1920).
Aridity indices provide a simple way to express the ratio of precipitation
to evaporation. Since evaporation is rarely observed it is a common tradition
to approximate it. In the approximation by De Martonne evaporation is set to
mean annual temperature TA in °C +10. The aridity index of De
Martonne AM is therefore defined as the ratio of the annual
precipitation sum PA in mm and the annual mean Temperature in
°C +10. It is obvious that one disadvantage of this definition is that the
equation has a pole at –10°C where the index is undefined. Lower temperatures
lead automatically to negative indices. One may argue that the whole concept of
aridity/humidity may not make much sense in cold regions. However, since we
draw global maps we have to deal with this problem. In order to use the index
world wide we define
Note that the higher this coefficient is, the higher is the
precipitation compared to evaporation and thus the less arid is the climate.
This means that by definition a high aridity index means a humid climate while
a low aridity index means an arid climate. The following map shows the aridity
index for the 50 year period from 1951 to 2000 based on temperature data of the
CRU and precipitation data from GPCC VASClimO. It can be downloaded as a bitmap
here.
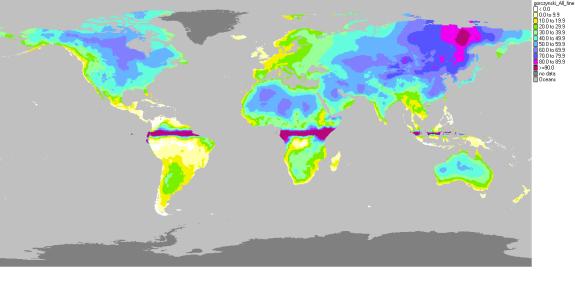
The continentality index of Gorczynski KG is a simple
but efficient way to estimate the influence of the ocean on the local climate.
The index depends linearly on the annual temperature amplitude A
(difference of monthly mean temperature of warmest and coldest month). However,
A not only depends on the strength of the influence of the ocean but
also on the annual cycle of incoming solar radiation. Since the amplitude of
the annual cycle of incoming solar radiation depends on latitude, with a maximum
in the polar regions, the inverse of the sine of the latitude j gets in as well. The definition in the version of
Gorczynski is
![]()
This original equation comes with some drawbacks. Since the sine
approaches zero as the latitude approaches the equator, the values close to the
equator tend to infinity. At the equator the definition breaks down. We
therefore suggest not using the index values within a latitude range of
plus/minus 10 degrees. In order to apply the definition also to the southern
hemisphere we use the absolute of the latitude instead of the latitude itself.
The following map shows the continentality index for the 50 year period from
1951 to 2000 based on temperature data of the CRU. It can be downloaded as a
bitmap here.
Download
colour tables for IDA images of De Martonne
aridity index and of Gorczynski continentality index here.
|
De Martonne aridity index and Gorczynski continentality index |
||||
|
Index |
Full Period 1951 – 2000 |
Norm Period 1961 – 1990 |
Early Period 1951 – 1975 |
Late Period 1976 - 2000 |
|
Gorczynski
(CRU) |
|
|
|
|
|
De Martonne CRU |
|
|
|
|
|
De Martonne GPCC Fulldata |
|
|
|
|
|
De Martonne GPCC VASClimO |
|
|
|
|
Download
this file as pdf.
References
Beck, C., J. Grieser and B. Rudolf, 2005: A New
Monthly Precipitation Climatology for the Global Land Areas for the Period 1951
to 2000. Klimastatusbericht
2004, 181-190, DWD.
[pdf]
De Martonne, E. (1941) : Nouvelle carte mondiale de
l’indice s’aridité. Météorol. 1941, 3-26.
Gorczynski, W. (1920) : Sur le calcul du degré de
continentalisme et son application dans la climatologie. Geogr. Annaler 2,
324-331.
Mitchell, T., and P. Jones, 2005: An improved method
of constructing a database of monthly climate observations and associated
high-resolution grids. Int. J. Climatol., 25, 693-712. http://www.cru.uea.ac.uk/
Rudolf, B.,
C. Beck, J. Grieser, U. Schneider, 2005: Global Precipitation Analysis Products
of the GPCC. Internet publication at http://gpcc.dwd.de/ [pdf]